


Using Opentelemetry instrumentation and tracing to mitigate performance bottlenecks.
A Comprehensive Guide to Instrumentation and Tracing


In the dynamic landscape of web development, optimizing the performance of applications is not just a goal but a necessity. When it comes to NestJS Apollo GraphQL applications, incorporating Opentelemetry instrumentation and tracing can significantly enhance your ability to identify and mitigate performance bottlenecks. In this guide, we'll walk through the steps to set up instrumentation within a NestJS Apollo GraphQL web application, allowing you to gain valuable insights into the request flow and performance characteristics of your application.
Use jaeger UI, Nest JS, Apollo GraphQL, Docker
We're enhancing our NestJS Apollo GraphQL app with Opentelemetry for detailed tracing. Jaeger UI visualizes this data, showing performance insights. Docker ensures a consistent environment for easy development and debugging. This setup streamlines building and optimizing high-performance apps.
Setting up instrumentation in a NestJS Apollo GraphQL web application
Setting Up NestJS Apollo GraphQL
create a NestJS app and install Apollo graphQL
npm i -g @nestjs/cli
nest new nestjs-api
cd nestjs-api
npm install
npm install @nestjs/graphql @nestjs/apollo @apollo/server graphql
Installing Opentelemetry Packages
Install packages
npm install @opentelemetry/semantic-conventions
npm install @opentelemetry/exporter-trace-otlp-http
npm install @opentelemetry/instrumentation
npm install @opentelemetry/instrumentation-express
npm install @opentelemetry/instrumentation-graphq
npm install @opentelemetry/instrumentation-http
npm install @opentelemetry/sdk-trace-base
npm install @opentelemetry/sdk-trace-node
npm install @opentelemetry/resources
npm install @opentelemetry/api
npm install @opentelemetry/core
installing these packages is crucial for setting up instrumentation and tracing in your NestJS Apollo GraphQL application. These packages provide standardized conventions for telemetry data, enable exporting trace data to compatible backends like Jaeger, offer core instrumentation functionality, and provide specific instrumentation for Express.js and GraphQL, ensuring comprehensive visibility into the performance and request flow of your application.
Configuring Tracing withtracer.ts
Create tracer.ts file to configure tracing
// Import required symbols
import { Resource } from '@opentelemetry/resources';
import { SimpleSpanProcessor } from '@opentelemetry/sdk-trace-base';
import { NodeTracerProvider } from '@opentelemetry/sdk-trace-node';
import { registerInstrumentations } from '@opentelemetry/instrumentation';
import { HttpInstrumentation } from '@opentelemetry/instrumentation-http';
import { ExpressInstrumentation } from '@opentelemetry/instrumentation-express';
import { GraphQLInstrumentation } from '@opentelemetry/instrumentation-graphql';
import { OTLPTraceExporter } from '@opentelemetry/exporter-trace-otlp-http';

const provider = new NodeTracerProvider({
resource: new Resource({
      'service.name': 'nestjs-api',
    }),
});
const oltpExporter = new OTLPTraceExporter();
provider.addSpanProcessor(new SimpleSpanProcessor(oltpExporter));
provider.register();

// Register server-related instrumentation
registerInstrumentations({
    tracerProvider: provider,
    instrumentations: [
      new HttpInstrumentation(), //HTTP instrumentation
      new ExpressInstrumentation(), // Express instrumentation
      new GraphQLInstrumentation(), //GraphQL instrumentation
        //..Other instrumentation (DB instrumentation etc..)
    ],
});
we created a file named tracer.ts to set up tracing for our NestJS Apollo GraphQL application using Opentelemetry. Inside this file, we bring in important tools like NodeTracerProvider and OTLPTraceExporter. We use NodeTracerProvider to define our app's name and OTLPTraceExporter to export tracing data. After that, we link them together and enable tracing for parts of our app like HTTP requests, Express framework, and GraphQL queries. This helps us keep a close eye on how our app performs and how requests move through it, useful for improving its speed and reliability.
Enabling Instrumentation inmain.ts
enable the instrumentation in the main.ts or entry point of the application (Before booting up the app)
import './tracing'; //import the tracing for profiling and optimization
import { NestFactory } from '@nestjs/core';
import { AppModule } from './app.module';

async function bootstrap() {
  const app = await NestFactory.create(AppModule, {
    cors: true,
  });
  await app.listen(3000);
  app.enableShutdownHooks();
}
bootstrap();
activate Opentelemetry's instrumentation in the main.ts file, the entry point of our NestJS Apollo GraphQL application. By importing the tracing setup, we equip the app with tracing for profiling and optimization. Then, using NestFactory, we create the app instance from AppModule, configure it with options like enabling CORS, and start it on port 3000. Lastly, we enable shutdown hooks for smooth application termination.
Visualizing Traces with Jaeger UI
Run jaeger UI to visualize the traces
Use docker command to run the jaeger
docker run --rm --name jaeger -e COLLECTOR_OTLP_ENABLED=true -p 16686:16686 -p 4318:4318 jaegertracing/all-in-one:latest
Finally run your application, open few GraphQL endpoints (Queries and mutation)
and access http://localhost:16686/search to view the tracings for proper understaffing of the request flow.
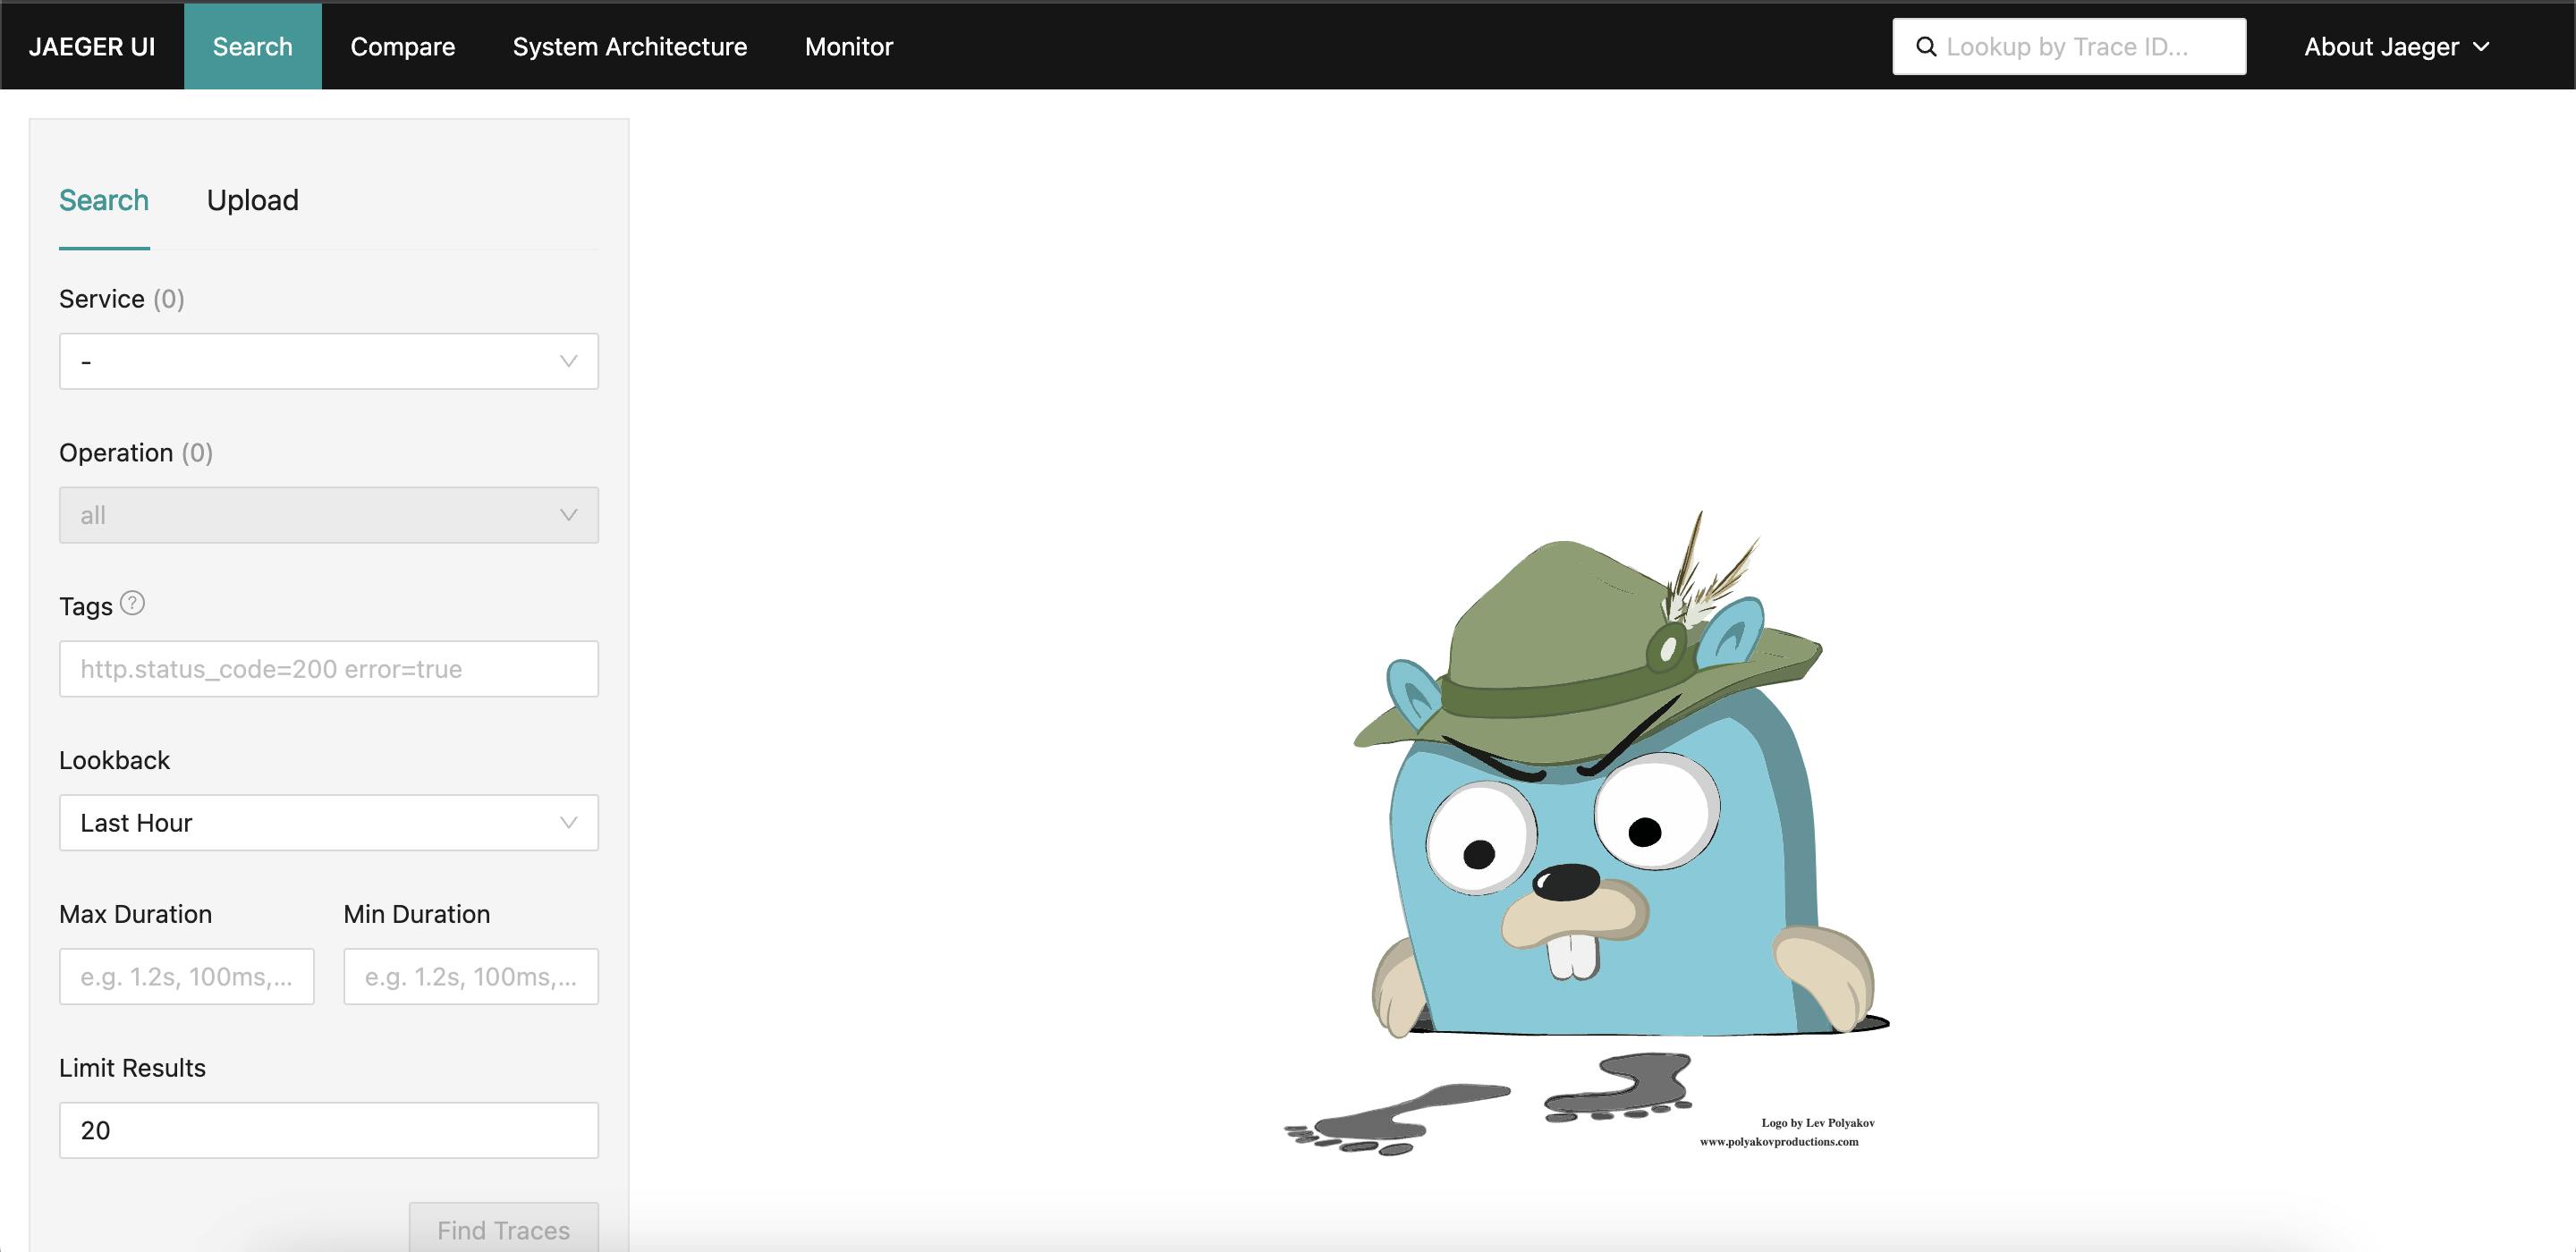
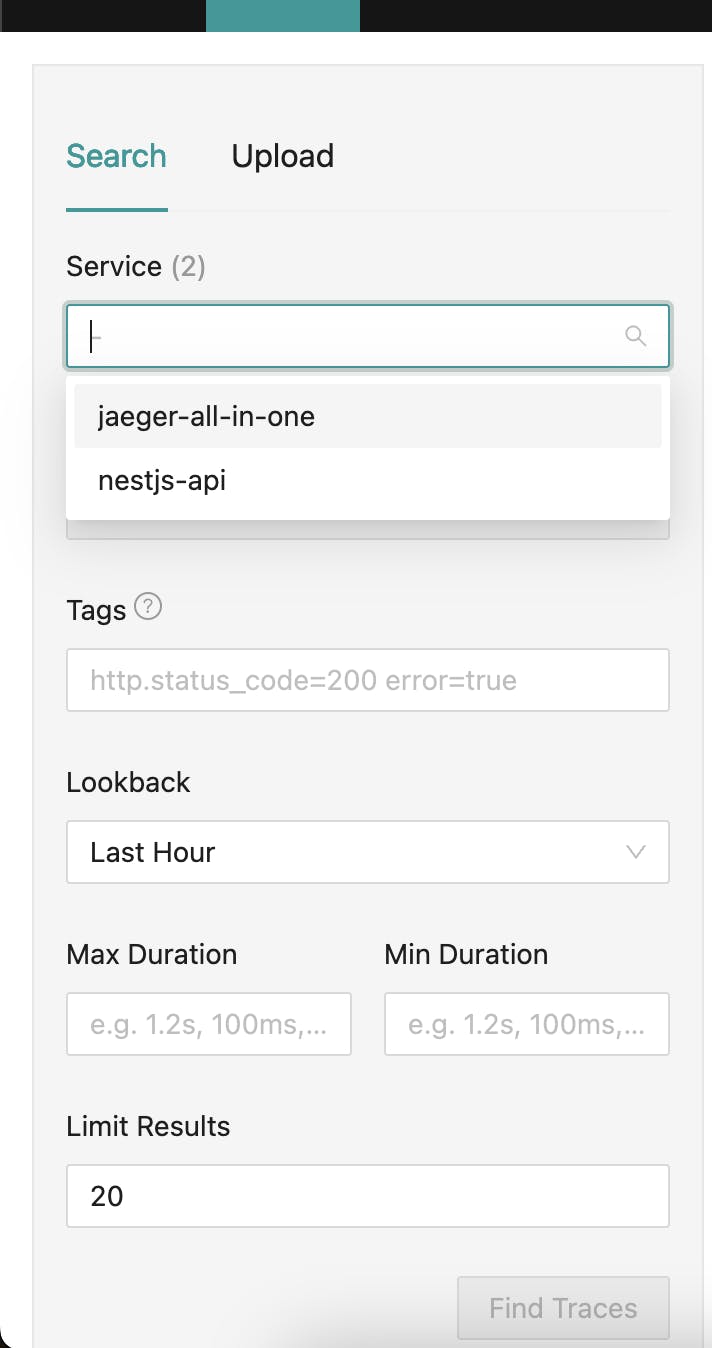
Select your service (nestjs-api)
Query the traces

Expand and view traces

Finally, run your NestJS Apollo GraphQL application and perform various GraphQL queries and mutations. Access the Jaeger UI at http://localhost:16686/search to view the captured traces and understand the request flow of your application.
Query the traces to analyze the performance of individual requests. Expand and view traces to identify potential bottlenecks and optimize critical sections of your application.